The following text field will produce suggestions that follow it as you type.

Loading Inventory...

Coles

Making Sense of Data III by Wayne P. Johnson, Paperback | Indigo Chapters

From Wayne P. Johnson

Current price: $142.95
Making Sense of Data III by Wayne P. Johnson, Paperback | Indigo Chapters

Coles

Making Sense of Data III by Wayne P. Johnson, Paperback | Indigo Chapters

From Wayne P. Johnson

Current price: $142.95
Loading Inventory...

Size: 20.8 x 236.2 x 19.36

Buy OnlineGet it at Coles
*Product information may vary - to confirm product availability, pricing, shipping and return information please contact Coles
Focuses on insights, approaches, and techniques that are essential to designing interactive graphics and visualizations Making Sense of Data III: A Practical Guide to Designing Interactive Data Visualizations explores a diverse range of disciplines to explain how meaning from graphical representations is extracted. Additionally, the book describes the best approach for designing and implementing interactive graphics and visualizations that play a central role in data exploration and decision-support systems. Beginning with an introduction to visual perception, Making Sense of Data III features a brief history on the use of visualization in data exploration and an outline of the design process. Subsequent chapters explore the following key areas: Cognitive and Visual Systems describes how various drawings, maps, and diagrams known as external representations are understood and used to extend the mind's capabilities Graphics Representations introduces semiotic theory and discusses the seminal work of cartographer Jacques Bertin and the grammar of graphics as developed by Leland Wilkinson Designing Visual Interactions discusses the four stages of design process—analysis, design, prototyping, and evaluation—and covers the important principles and strategies for designing visual interfaces, information visualizations, and data graphics Hands-on: Creative Interactive Visualizations with Protovis provides an in-depth explanation of the capabilities of the Protovis toolkit and leads readers through the creation of a series of visualizations and graphics The final chapter includes step-by-step examples that illustrate the implementation of the discussed methods, and a series of exercises are provided to assist in learning the Protovis language. A related website features the source code for the presented software as well as examples and solutions for select exercises. Featuring research in psychology, vision science, statistics, and interaction design, Making Sense of Data III is an indispensable book for courses on data analysis and data mining at the upper-undergraduate and graduate levels. The book also serves as a valuable reference for computational statisticians, software engineers, researchers, and professionals of any discipline who would like to understand how the mind processes graphical representations. | Making Sense of Data III by Wayne P. Johnson, Paperback | Indigo Chapters

More About Coles at Village Green Shopping Centre

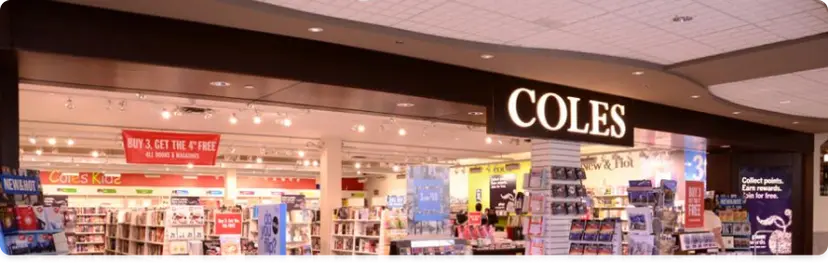
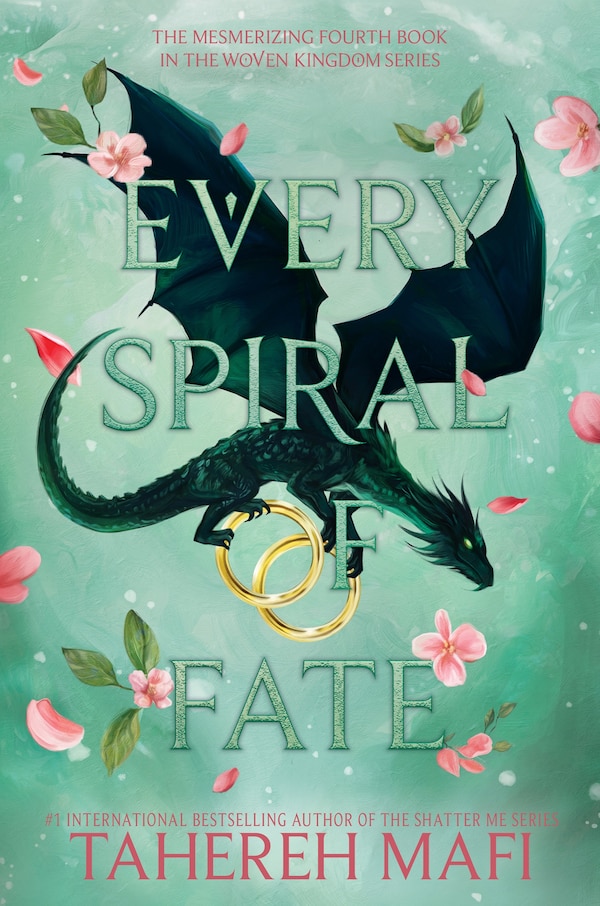
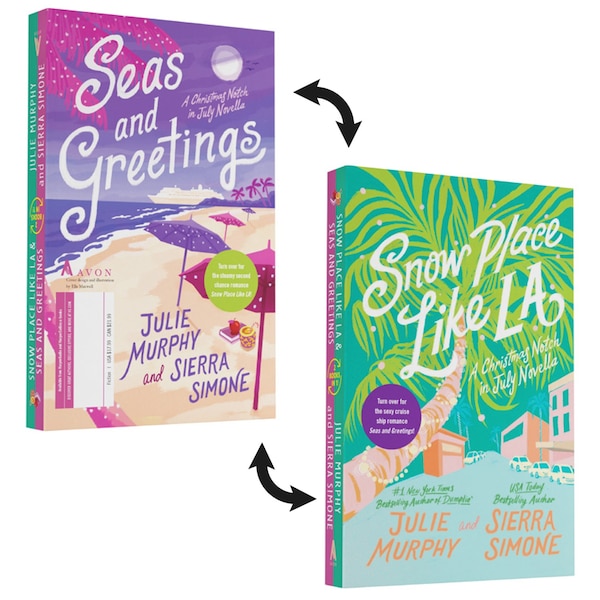
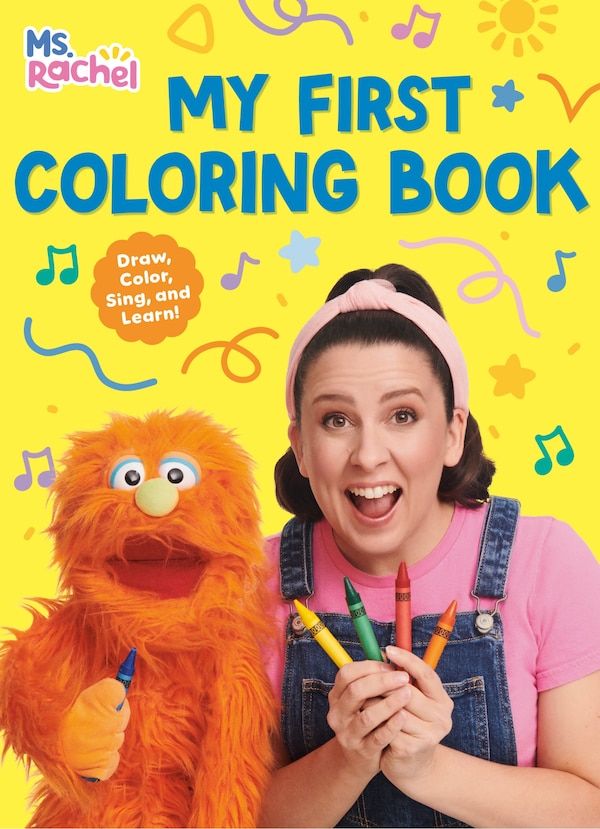
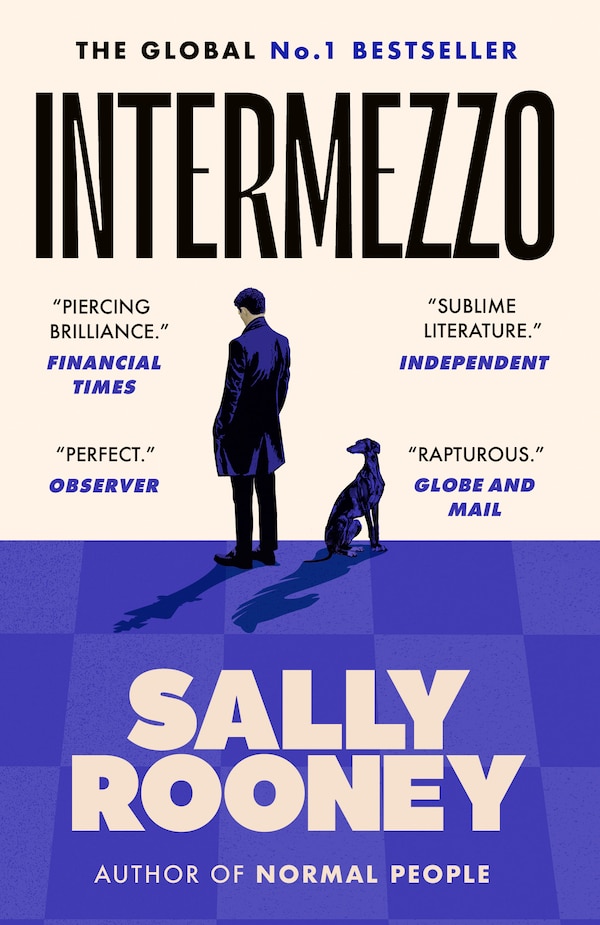
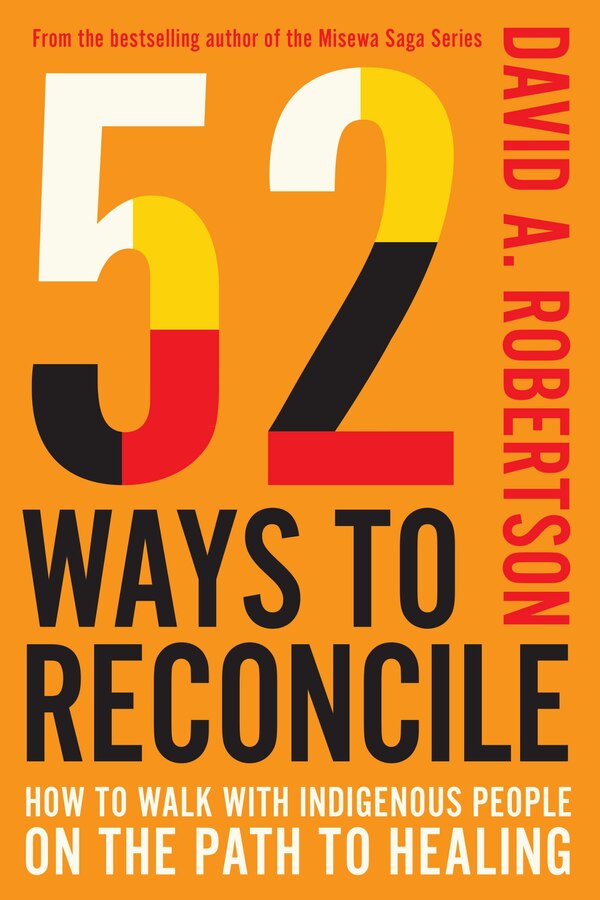
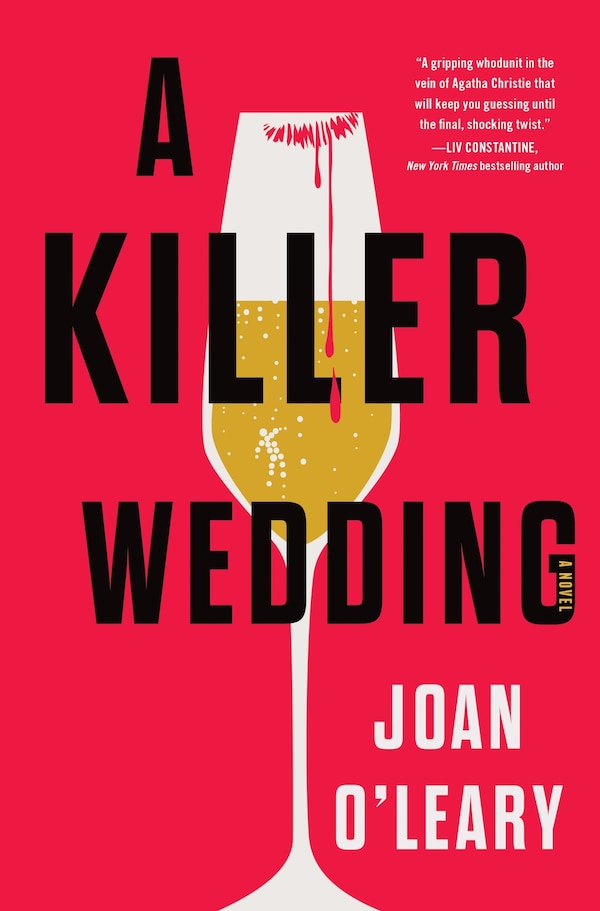
Find everything in-store including new, used and children’s books, music, movies, games and toys. Visit Coles today to find the perfect gift, or a novel for yourself. COVID-19 UPDATE: Open | Regular Centre Hours

Powered by Adeptmind